
Overview
I’ll share what I think are helpful tips for housing professionals using systems (Advocate by Symplicity) and software (Microsoft Office) that are common tools in higher education. Today’s focus will be on using pivot tables to get descriptive statistics on your student conduct. Specifically, we’ll use the reporting tool to create a spreadsheet of data from cases marked “Closed Responsible” and the students involved in those cases. Our residential conduct procedures process each parent case into individual child cases, giving a 1:1 ratio of student to case, which is an important caveat to the process described below.
Getting the Data
First, I use the reporting tool in Symplicity to extract the data I need about student conduct. This is done using the “Reporting” tool. Choose “Add New Report”. Select the following fields:
- Base Class: Incident
- IR #
- Incident Types, collapsed into Single Row
- Date and time of the incident, filtered to desired range
- IR Status, filtered to “Closed Responsible”
- Incident: Administrative Actions: Found Responsible (collapsed into single row)
- Incident: Record of Students at time of Incident: Student I
- Any other student fields you may want.
Run the report, then export the data to excel.
Using the Pivot Table
Within the excel spreadsheet of your data, use CNTL+A to select all the data in your spreadsheet. Use the excel “Insert” tab on the ribbon and choose “Pivot Table”. I typically open the table in a new worksheet. In the pivot table builder, place the Student ID field in “Rows” section. Place the same field in the “Values” section and ensure it’s using the “Count” function.

If you’re looking for a simply count of students found in violation and the number of times each student violated policy, you’re done. Always double-check the table by searching Advocate by a student ID and ensuring the pivot table “count” value matches the number of “CR” cases in the student’s profile.
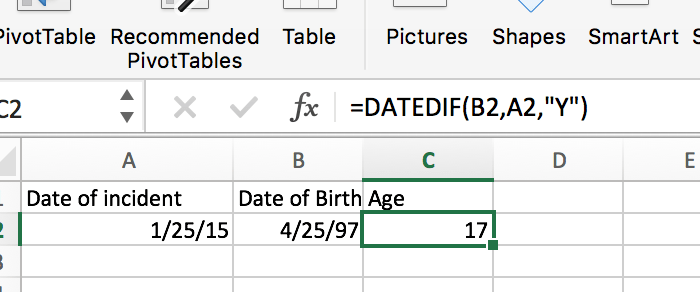
The pivot table allows you to run many different reports that describe the population of students who violated conduct. For example, replace the “Student ID” field in the “Rows” field of pivot table with “Gender” and you now have a count of the number of cases in which the genders defined in your system were found responsible. I included the Symplicity field “Date of Birth” in this table, however the “Age” value in Symplicity is calculated, not stored. If you included the “Date of Incident” field in your report, you can now create a column that calculates the student’s age at the time of the incident. See the example below:
Advocate report spreadsheets and pivot tables together are powerful tools for assessing your student conduct process.
